Python Basics and Biostatistics
The Gaussian Distribution
Back to index
In this lesson the student will learn how to:
- calculate the z for an individual score
- recognize a Gaussian distribution
- recognize Python built in functions
By the end of this lesson the student will be able to:
  Write a script to calculate the z for an individual
  score given the SD and mean for a data set.
This is not likely to be the case when variation is largely due to one
factor (such as would be the case if the variation were due to only
one gene). In this case you expect either a skewed distribution or a
bimodal distribution instead of a Gaussian distribution. For instance,
imagine that 90% of variation in height could be accounted for by a
single gene and that other genes and environmental factors had only a
combined effect of 10% on the resulting phenotype observed in individual
subjects in our sample. In this case we would quite possibly see a skewed or
bimodal plot of our data for adult human female height which might
possibly reflect breeding trends which are influenced by various
social factors. Since height, however, is acually influenced by
many genes and many environmental factors, a
Gaussian distribution will almost certainly be reflected in our data.
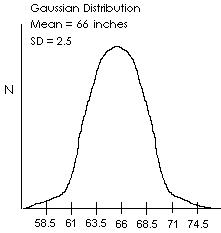
The mean is at the center or peak in a Gaussian distribution. The SD is a
measure of the spread of the distribution. The entire population is
represented by the area under the curve. Two thirds of the population
will be within one SD of the mean. The number of SD's from the mean at
which an individual value falls is referred to as that value's z. A z
of zero would be the z for a score which equals the mean. The z is
calculated using this formula.
z = abs(Y - mean) / SD
The abs function is short for absolute value. (For instance, the absolute
value for both 5 and -5 is 5 since absolute value refers to the distance
of a value from zero.)
As you can see, z is just the number of SD's from the mean of single score.
So, let's say that we have some data with a mean of 66 and a SD of 2.5.
Let's say we have an individual with a score of 62 and we want to know
the value of z. To find z, we just plug in the numbers like this:
   z = abs( 62 - 66 ) / 2.5
     = 4 / 2.5
     = 1.6
So, we find that the z for our individual is 1.6 and since our individual
is below the mean we could say that our individual score is 1.6 SD's below
the mean.

Python Script to Calculate z
As luck would have it (and as you will hopefully recall), Python provides
us with a function to find the absolute value of a integer. It's as easy
as this:
val = abs(-5)
We can also use it for expressions like this:
a = 10
b = 5
val = abs(b-a)
In both examples val winds up with positive five stored in it.
Python Built In Functions and Math Functions
At this point you have used several built in functions and math functions.
Usually you assign the output of a function to a variable like this:
n1 = math.sqrt(81)
n2 = abs(x)
There are MANY built in functions and math functions which we will be using in the future.
Assignment:
Write a Python script which calculates the z for a score. Your script will take three inputs:
1) mean, 2) SD, and 3) individual score. It will provide output in this form:
  Mean: 100
  SD: 12.5
  SCORE: 122.5
  z: 1.8