

Write a Python script to divide a group of data points into quartiles.
Height of Nine-Year-Old Girls in Trona, 2003:

 height    number
   3'11"     1
   4' 0"     2
   4' 1"     1
   4' 2"     0
   4' 3"     2
   4' 4"     2
   4' 5"     1
   4' 6"     0
   4' 7"     1
   4' 8"     0
   4' 9"     2
   4'10"     1
   4'11"     0
   5' 0"     0
   5' 1"     1
With the numbers in order it is easy to identify quartiles.
0-25%    47, 48, 48
26%-50%  49, 51, 51
51%-75%  52, 52, 53, 55
76%-100% 57, 57, 58, 61
The ties in our data forced us to group our numbers so that our quartiles were slightly less than even. This is likely to be less of a problem with large data samples, but this also depends in part on the range of possible scores. In general, since we had 14 subjects, each quartile should contain 14/4 or 3.5 subjects. Since we can't split a subject in two this means that there should be 3 or 4 subjects per quartile. Of course you can imagine a situation where all fourteen were the same height, in which case we really couldn't assign quartiles. Quartiles are all about distribution of data points.
Box and Whisker Plots
We can graphically represent this information in a number of ways. The most commonly used way is to use a simple bar graph:
| Number of individuals | Height Distribution | |||
|---|---|---|---|---|
| 5 |  |
 |
 |
 |
| 0 | 47-50 | 51-53 | 54-57 | 58-61 |
 |
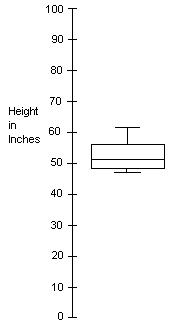
Another interesting way of graphing the data is to use a "Box and Whisker" plot. In this plot the middle line represents the median. The very top line represents the greatest value. The lowest line represents the lowest value. The top of the box represents the 75th percentile. The bottom of the box represents the 25th precentile. The box-and-whiskers plot is a good way of representing the distribution of data points. It is important to remember that percentile, quartile and median in the context of this lesson all refer to distribution of data points and that the arithmetic mean or average is about data values. |
This script is longer and more complicated than previous scripts. You should get it up and running, experiment with it, and read it carefully (including the comments) before proceeding.
myD = {}
Then we add items one at a time like this:
myD{key} = value
The following will all work as ways of adding values to hashes:
  myD{10} = 77
  myD{'ten'} = 66
  myD{'one'} = 'The elephants are attacking!'
After we have stored our data in our hash table we need to retrieve the
data. We do this by using the keys function like this:
list_of_keys = myhash.keys()In order for these keys to be useful we must sort them. There is no guarantee that the keys will be returned from the keys function in the order in which we stored them and so sorting is necessary. For this script the keys must be sorted into numeric order and so we use the sort function followed by the compare construct:
Logical AND Operator
The logical AND operator (and) allows you to construct compound conditional statements. In other words, the if statement is true only if BOTH of the conditions are met. We use the and operator four times in this script.
Use of Flags
In this assignment the q_flag variable is used as a flag. It is just a normal scalar (there is nothing special about it from the point of view of the Python interpreter), but we use it in the ROLE of a flag. When it is set to 1 we print a quartile heading and when it is set to zero we don't.
![]()
ASSIGNMENT:
You will make one small adjustment to this script. Instead of using quartile headings like this:
  Quartile 1:
  Quartile 2:
  Quartile 3:
  Quartile 4:
yours will look like this:
    0%-25%:
   26%-50%:
   51%-75%:
  76%-100%:
Make sure your headings are offset as shown.
The easiest way to make this change is to use a list containing these four headings and access them using the typical array indexing method: