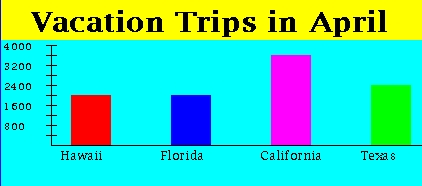
This bar graph represents the number of vacation trips people took to various places. According to this chart:
Here's another bar graph to inspect.

This bar graph represents the number of vacation trips people took to
various places. According to this chart: